The charts behind your decisions.
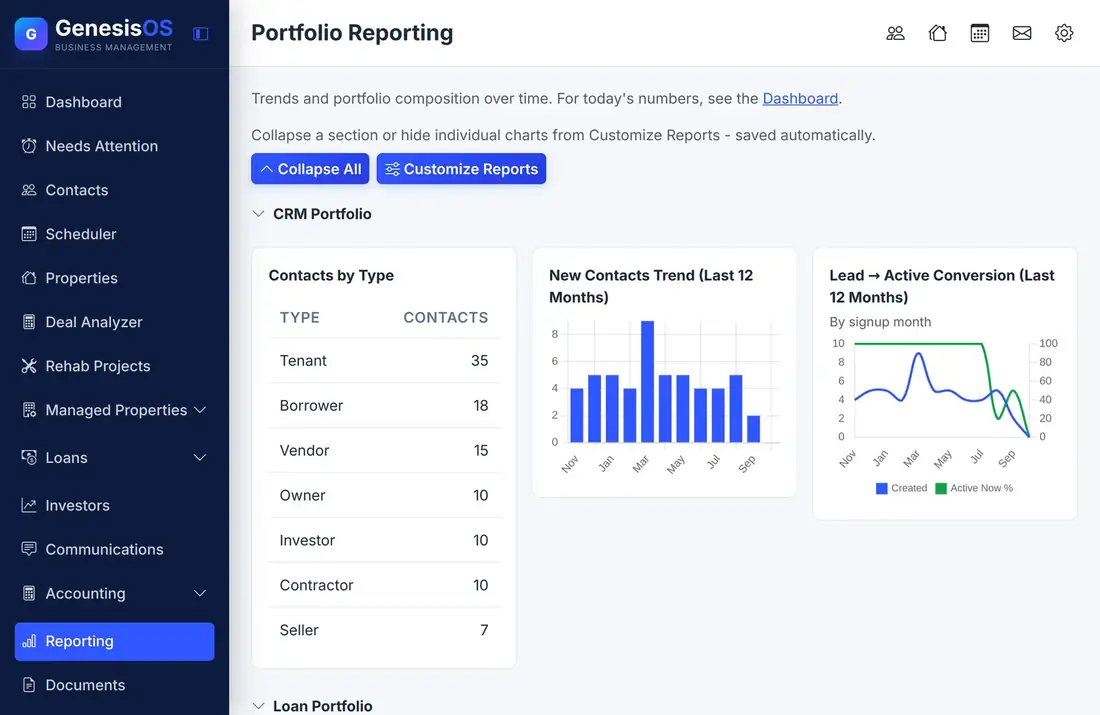
Portfolio Reporting turns the work you do every day into charts and tables: contacts by type, loan volume, deals by strategy, and rehab spending. Each section appears only for the modules you use, and you choose what to show.
- One page for the whole portfolio
- A section for each module you use
- Sections you can show, hide, and fold
See the pattern, not just the record.
A section per module
Reports are grouped into Contacts, Loans, Property Management, Deal Analyzer, and Rehab Projects, and a group only appears when its module is on.
Loan reports
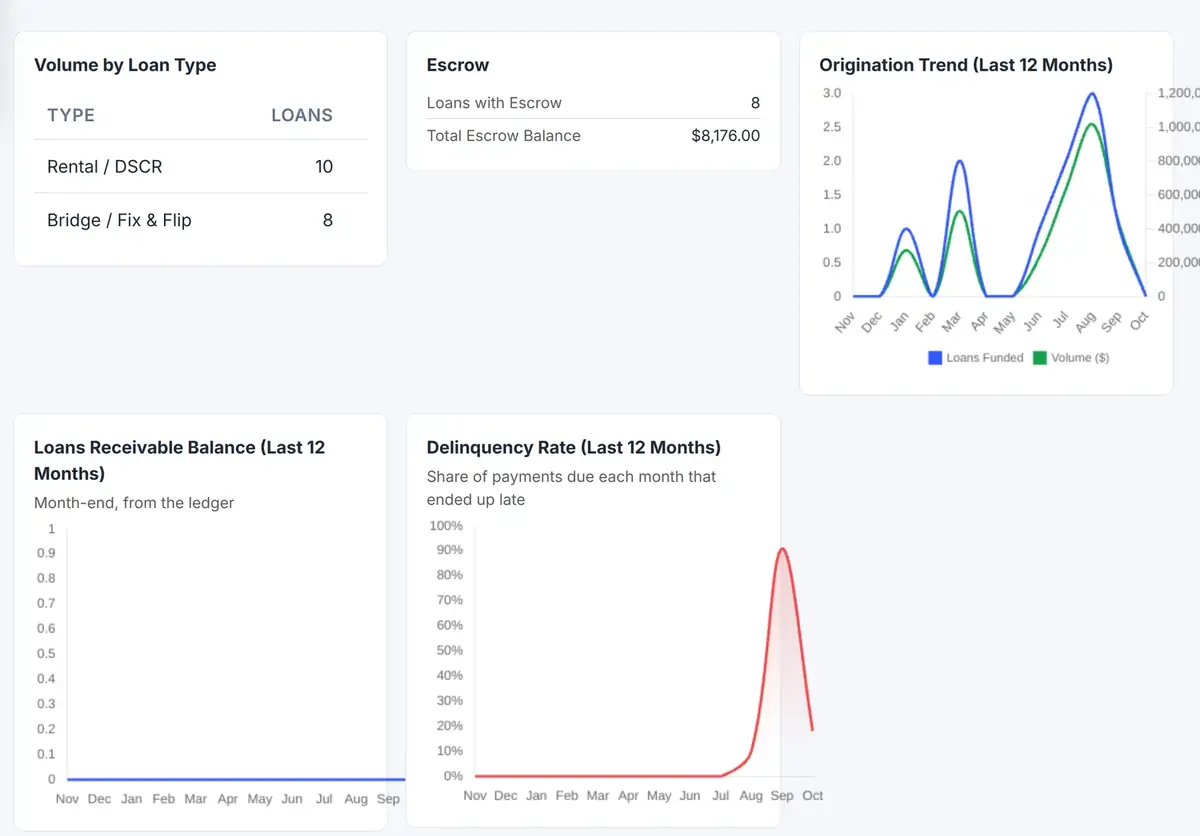
See loan volume by type, origination over the last twelve months, the receivable balance, the delinquency rate, and escrow.
Contact reports
See how many contacts you have of each type, how many new contacts arrive each month, and how leads turn into active contacts.
Rental reports
Follow the performance of the properties you manage, from the Property Management section.
Deals and rehabs
See deals by strategy and the analyses you generate, and, in Rehab Projects, projects by stage, budget against spending, top contractors, and change orders.
Make it yours
Fold a section closed or hide the charts you never use with Customize Reports. Your choices are saved automatically.
Loan charts on one screen
When Loan Pipeline and Loan Servicing are on, the Loan Portfolio section shows volume, escrow, origination, receivables, and delinquency.
 1234
How much you have lent, split by the kind of loan.
The escrow balances you hold.
New loans over the last twelve months.
What borrowers owe you, over time.
From the first step to a finished job.
Your modules show up
Each module that is on adds its own section to the page.
Open the page
Charts and tables fill in from your own records.
Tidy it
Fold sections closed or hide charts with Customize Reports.
Come back
Your layout is saved, so it is the same next time.
A quarterly review
At the end of a quarter, you open Portfolio Reporting and fold everything except the loan section.
Volume by type and the delinquency rate answer the first two questions your partners will ask before the meeting starts.
Sample list. The charts come from your own records.
Connected to the rest of your operation.
Good to know.
Need a module we don’t have?
GenesisOS is modular, so we can build one just for you.
Run your business from one connected system.
Replace disconnected handoffs with shared records, purpose-built modules, and workflows that move the work forward.